How to Use a Gantt Chart: A Beginner’s Guide for 2025
New to Gantt charts? We’ll explain what exactly this handy project management tool is, then show you step by step how to use a Ganntt chart, plus discuss the potential shortcomings of using one.
Gantt charts are a very specific tool aimed at certain types of workflows — usually those that depend strongly on one task or process finishing before the next can be started. In this article, our project management experts will walk you through how to use a Gantt chart, as well as go over the origin and uses of this handy project management tool.
Key Takeaways:
- Gantt charts were first developed by Henry Gantt at the start of the 20th century, most likely building on the work of Polish and German engineers.
- Gantt charts are a great way to keep track of interconnected, complicated tasks and projects — not so much for simple task management.
- While Gantt charts are a powerful tool, it’s very easy to over-complicate matters, so use them sparingly.
Overall, Gantt charts are a great way to manage projects, but they aren’t as useful all around as, say, kanban boards. That said, when they work, they work really well. Once you decide that they’re a good fit for your project management, you’ll soon find they become indispensable.
If you already know about Gantt charts and just want to know which one is the best out there, we recommend you take a gander at our TeamGantt review. It has Gantt charts in its DNA, and we like it so much that we’ll be using it for our Gantt chart examples later in this article. If you need something with a bit more oomph overall in addition to charts, check out monday.com or Asana instead.
What Is a Gantt Chart and How Does It Work?
A Gantt chart is a horizontal bar chart that displays the progress of a project (or, if you want to get really old school, a project schedule). It’s named after its inventor, Henry Gantt, who designed it in the 1910s or thereabouts. Whether he was the originator, though, is very much in dispute.
Gantt was a mechanical engineer who spent most of his career developing new ways to manage resources and people. In his time, there was a huge shift in how work was done, as business in the United States was booming and industries grew exponentially.
The Gantt chart was developed as a way to keep track of everyday tasks and easily measure individual workers’ productivity. They quickly grew very popular in any organization that relied heavily on logistics — for example, they saw wide use in the American armed forces during World War I.
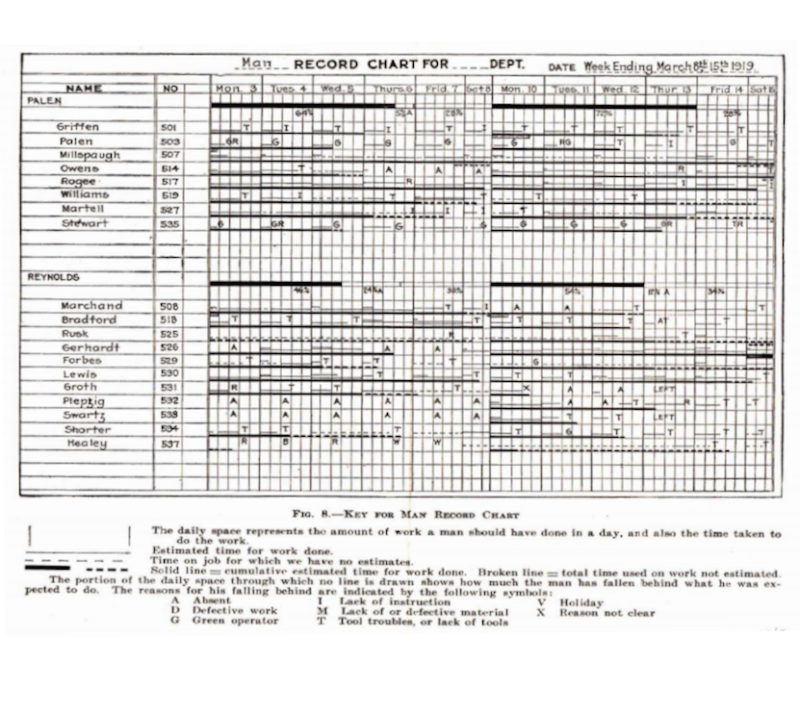
Source: Gantt, 1919, p. 88.
Origin of the Gantt Chart
There are different theories about how Gantt came up with the idea of the charts now named after him, but it seems likely that his ideas weren’t developed in a vacuum.
For example, a Polish engineer named Karol Adamiecki developed a similar chart, called the harmonogram, about 15 years before the Gantt chart came on to the scene. Exactly how much Gantt was inspired by it is unsure, as is the role of a German engineer called Hermann Schürch who used Gantt-like charts in large construction projects.
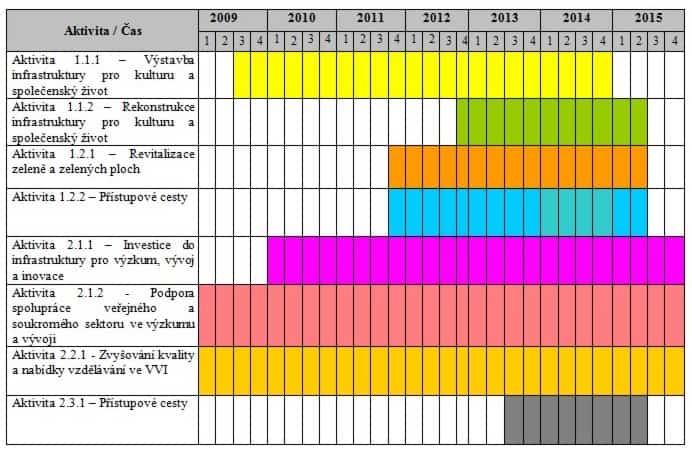
Source: zlin.eu.
Schürch could have been using the inventions of either Adamiecki or Gantt, or could simply have been using a type of bar chart that had been in use in the German construction industry for decades. If you’d like to know more about this subject, we recommend this article by Patrick Weaver.
When Should You Use a Gantt Chart?
The main use for Gantt charts are large, complex projects where there are a lot of dependencies. Of course, they’ve moved beyond the pencil-and-paper variant to ones you can use digitally, often in the cloud. Nowadays, when you use a Gantt chart, you’re really using an online Gantt chart tool like TeamGantt or GanttPro (read our GanttPro review).
However, Gantt charts aren’t for everybody. Their main use is to measure overall progress in companies where one task is dependent upon another.
One good example is construction, the industry Schürch worked in. For this reason, Gantt charts pop up a lot in our roundup of the best project management software for construction companies.
Construction projects are huge, complicated affairs. Not only do they involve a large number of people to schedule and plan — some of whom will be independent contractors, further complicating matters — you can’t move into the next phase of a project until the last one has been finished. After all, you can’t build a ceiling unless the floor below it is done.
Add to that some logistical headaches in the form of deliveries of materials and you have a project manager’s nightmare. Gantt charts help manage this — the headache as well as the process — by setting what are called dependencies between tasks, which show what needs to be done before you can move on to the next task.
For example, if you set a dependency between two tasks, you know that you can’t start task B until task A has been completed. In our above example, you know you can’t start laying a brick wall until the bricks for it have been delivered. If there’s a delay with the delivery, moving up the bricks in the chart automatically moves the laying of them, too.
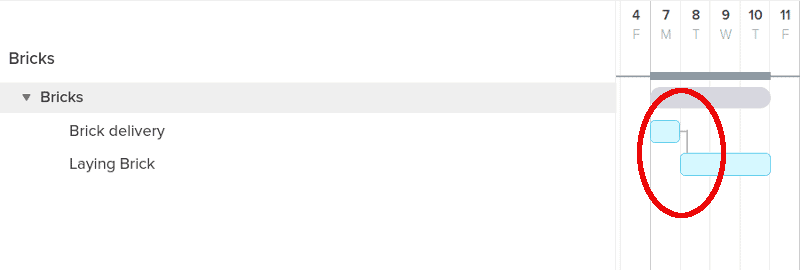
You can also — depending on the Gantt chart software you use — set subtasks that will help you measure overall task progress. This isn’t limited to Gantt tools, of course, but when used with charts can create a very clear path to follow from one step to the next.
Potential Problems and Limitations of Gantt Charts
Gantt charts are interesting because their strength in handling complexity is also their weakness. This weakness comes in two basic flavors: you can use them to manage projects too simple to need a Gantt chart, or you can rely on them so heavily that your entire project schedule can turn into bar chart soup.
For the first case, let’s use an editorial calendar as an example: to manage the flow of our articles at Cloudwards, we use kanban board Trello (read our Trello review to find out why). Each article is a card, and we move them between columns to denote the stage each piece is in. Easy-peasy, and so far the only issues we’ve had were user errors.
Using a Gantt chart, however, would badly over complicate matters. The dependency between individual tasks is already shown by columns in Trello, so setting them explicitly adds very little. In fact, it would complicate things, as a bar chart gives you less overview than a kanban board does, in our estimation.
On top of that, you’d spend more time setting up your project than actually working on it: a Gantt chart is a labor-intensive thing to set up, so we generally don’t recommend doing so unless you really need to (or if you need something other than meetings to waste your time).
The other side of that coin is that you can rely too heavily on Gantt charts, making your entire workflow into some kind of mental prison with the jeering ghost of Henry Gantt as your jailer. In this scenario, delaying one single task causes a cascade of changes that reverberate into the foundations of your office, shaking it and you like maracas.
Seriously, though, if your Gantt chart looks like an unending waterfall of bars that you need to squint at to understand, you need to consider using one of the best kanban apps in conjunction with your Gantt chart. There is such a thing as too much complexity, and Gantt charts can easily devolve into it.
Getting Started With Gantt Charts
Before we dive into the ins and outs of using Gantt charts for yourself, here are some reviews of tools with Gantt functionality built in, culled from our roundup of the best project management software, aside from TeamGantt.
- monday.com review — A powerhouse project management tool with decent Gantt features
- Asana review — A great overall management tool with a good Gantt chart
- Wrike review — A powerful, if drab, Gantt tool as well as excellent calendar
- Airtable review — A spreadsheet-based tool, with a great Gantt chart
- GanttProject review — A dedicated tool with weaker features overall
- Notion App review — A collaboration tool with Gantt chart in the Timeline view
How to Use a Gantt Chart Effectively for Project Management
To avoid the above scenario, you need to use a Gantt chart sparingly, and split projects over different sheets. If you cram every single task within your company into a single Gantt chart, all you’re doing is laying the foundation for a major headache when something goes wrong, and things will always, eventually, go wrong.
Below we’ll give an example of a very simple Gantt chart that should serve as a template for your own projects. We’re using TeamGantt as an example, but we’ll avoid any of its special features so you can easily use our instructions in other software — we have some examples below.
Creating a Sample Gantt Chart
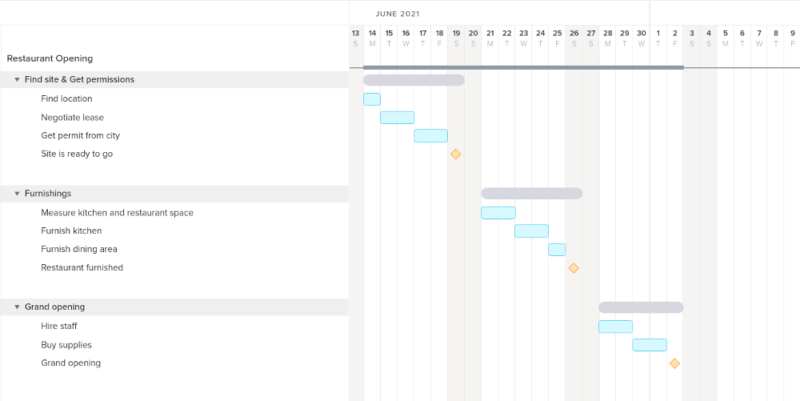
Getting started with Gantt charts is easy — it’s managing them that’s tricky. To start, either use a template (most Gantt chart software comes with a few) or, if you’re like us and like things the hard way, open up a fresh, new chart. For fun, we’ll pretend to open a restaurant, and we’ll do so in the record time of just three weeks.
- Divide Your Project Into Groups
One thing that will help you as you move along is to divide your projects into subprojects, called “groups” when you use TeamGantt. This will help you keep track more easily. For this example, we’ll use three groups.

- Add Tasks to Each Group
Next, we need to add tasks to each group. We’ll keep things relatively simple here, so just a few per group. We also need to add a milestone for each group, meaning the point at which we consider the group finished and we’re ready to move on to the next group. We’ll also add dates on all tasks. (Note that all these predictions are wildly unrealistic.)
- Set Dependencies for Each Task
With groups and tasks set up, it’s time to add dependencies, or the relations between each task. In our example, it’s really easy, as everything runs so linear — especially since we’re using TeamGantt. All we need to do is click and drag from one task to the next to set up a dependency.
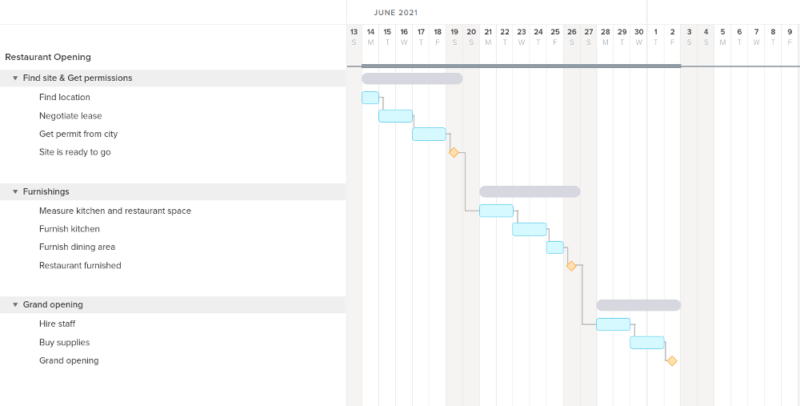
With dependencies set up, every time we move one task, we move all its dependent tasks, too. This is great if your project hits a hiccup — in our example, an unruly bureaucrat, say — but you need to make sure the hiccup truly affects the whole project, instead of just one stage.
For example, if furnishing the kitchen takes an extra day, that might not be a problem; you could just paint the dining area, or move that into the weekend. As such, it’s important when setting up a Gantt chart to really, truly make sure tasks are dependent on each other. If you don’t, you’ll end up with a spider’s web that will have you stressed out every time something doesn’t go according to plan.
Final Thoughts
As you can tell, Gantt charts are a powerful but tricky tool for project managers. While they can get a lot done, an overreliance on them might cause you more stress than any other tool out there, meaning you should use them wisely.
That said, when used right, nothing beats a Gantt chart for making complicated projects run smoothly. If you have experience with this, please let us know in the comments below. As always, thank you for reading.
FAQ
Yes, plenty. Some of the best Gantt software offers free options, including TeamGantt and GanttProject.
The best Gantt-focused software is probably TeamGantt, though plenty of other suites include Gantt charts, including monday.com, Asana, Wrike and Airtable
You can insert a bar chart into your sheet, then flip it over so you can use it as a Gantt chart. This is pretty laborious, though, and you’re much better off signing up for a dedicated tool.

